Rates of reactions: questions
1. There is a danger in coalmines that coal dust may catch fire and start an explosion. Explain why coal dust is more dangerous than pieces of coal.
Coal dust can explode when ignited.
2. ‘Alko’ indigestion tablets and ‘Neutro’ indigestion powder are both alkalis. Which do you think will act faster to cure acid indigestion? Describe how you could test the two remedies in the laboratory with a bench acid to see whether you are right?
???
3. Catalysts A and B both catalyse the decomposition of hydrogen peroxide. The following figures were obtained at 20°C for the volume of oxygen formed against the time since the start of the reaction.
| Time (in minutes | 0 | 5 | 10 | 15 | 20 | 25 | 30 | 35 |
| Volume of oxygen with catalyst A (in cm3) | 0 | 4 | 8 | 12 | 16 | 17 | 18 | 18 |
| Volume of oxygen with catalyst B (in cm3) | 0 | 5 | 10 | 15 | 16.5 | 18 | 18 | 18 |
a. Plot a graph to show both sets of results
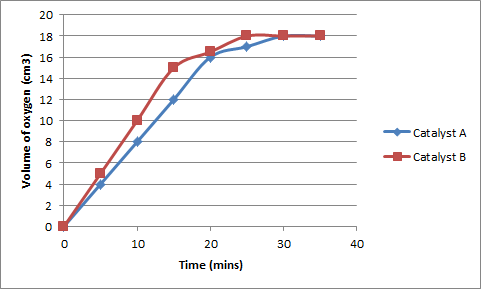
b. Say which is the better catalyst, A or B.
Although both catalysts rise to the same amount eventually, catalyst B is better and the volume of oxygen increases faster.
c. Explain why both experiments were done at the same temperature
To keep it a fair test, also both catalyst may work differently at different temperatures.
d. Explain why both sets of figures stop at 18 cm3 of oxygen
Because there is no energy left in the catalyst
e. Add a line to your graph to show the shape of the graph you would obtain for the uncatalysed reaction.
4. The graph below shows the results of three experiments involving the reaction of magnesium and dilute hydrochloric acid
 |
a. Which experiment has the fastest rate at the start?
1
b. Which experiment produced the greatest final volume of gas?
2
c. Which experiment used the most concentrated acid?
1
5. Copper (II) oxide catalyses the decomposition of hydrogen peroxide. 0.5 g of the copper oxide was added to a flask containing 100 ml of hydrogen peroxide. A gas was released. It was collected and its volume noted every 10 seconds. The table below shows the results:
| Time (in seconds) | 0 | 10 | 20 | 30 | 40 | 50 | 60 | 70 | 80 | 90 |
| Volume (in ml) | 0 | 18 | 30 | 40 | 48 | 53 | 57 | 58 | 58 | 58 |
a. What is a catalyst?
A substance which speeds up the rate of reaction but does not affect the chemical process.
b. Draw a diagram of suitable apparatus that you would use to carry out this experiment.
c. Name the gas that is formed.
Oxygen + (water)
d. Write a balanced chemical equation for the decomposition of hydrogen peroxide.
H2O2 ---> H2 + O2
e. Plot a graph of the volume of gas against time.

f. What happen to the concentration of hydrogen peroxide as the reaction proceeds?
The concentration decreases
g. What chemicals are present in the flask after 90 seconds?
Copper oxide and hydrogen peroxide
h. What mass of copper (II) oxide would be left in the flask at the end of the reacting?
0.5g
i. Sketch on your graph the curve that might be obtained when:
i) 1.0 g of copper (II) oxide is used (red line)
ii) 0.5 g of copper (II) oxide is used in a hydrogen peroxide solution of a lower concentration (anything below blue line)
6. The equation for the reaction between calcium carbonate and hydrochloric acid is
CaCO3 (s) + 2 HCl (aq) ¾® CaCl2 (aq) + H2 O (l) + CO2 (g)
Two different 10.0 g samples of calcium carbonate were reacted at 25 C with excess hydrochloric acid for a period of 6 minutes. One of the samples was in the form of large lumps and the other consisted of small lumps.
| | Mass of flask and contents (in g) | |
| Time (min) | Large lumps | small lumps |
| 0 | 112.4 | 111.6 |
| 0.5 | 111.6 | 109.2 |
| 1 | 111.1 | 108.3 |
| 2 | 110.2 | 107.4 |
| 3 | 109.6 | 107.2 |
| 4 | 109.1 | 107.2 |
| 5 | 108.7 | 107.2 |
| 6 | 108.5 | 107.2 |
a. Draw a diagram of apparatus which would be suitable for carrying out this experiment.

b. Explain why the mass of each flask and contents decreases.
The mass decreases because the hydrochloric acid displaces the calcium carbonate to form calcium chloride.
c. Draw two graphs on the same set of axes to show how the total loss of mass changes with time for each sample.

Total loss for red (small) = 3.9g
Total loss for blue (large) = 2g
d. On the same grid sketch the graph you would expect to obtain if the experiment was repeated with 10g of powdered calcium carbonate
No comments:
Post a Comment